Projections & simulation
Everything in this page comes from one script, scripts/economy_sim.py, which is in the public repository. Change an assumption, run it, and the tables and charts regenerate. We would rather you check our arithmetic than believe our adjectives.
What the model does
Day by day, for five years:
- New stands are bought at the ladder price. Players buy the LEMON they need from the DEX pool (limited to 10% of the pool per day) and the rest directly from the game at the band ceiling.
- Stands produce net of supplies until they reach their cycle cap, at a rate set by the current ladder price (the price index); 60% renew with a major repair (50% of the average price); after four repairs they retire and 30% of retirees buy a new stand.
- Players redeem 80% of their net production into LEMON (the other 20% goes to equipment, zones and boxes) and sell 80% of what they redeem on the DEX.
- The Bank pays redemptions from its LEMON; shortfalls are covered by the 20% emission allowance, then by reserve buybacks; anything left scales the rate down.
- Every GRAM (ExTON) the game collects is split 55% fund / 25% reserve / 10% team / 5% marketing / 5% prizes. The reserve defends the 0.05–0.15 band and adds 10% of direct sales to liquidity; 80% of it is in liquid staking. The fund stakes everything; its daily yield pays 10% to the team, then 20% recapitalises the fund and 70% is burned while the price is at or above the floor (the full 90% is burned below it). Staking yield: 12% base case.
The key assumption in one line
An average player nets ≈1 LEMON per day per 100 LEMON of the current ladder price after supplies, reaching a new stand's first cap (120% net) in about 120 days; with level speed-ups, the whole life — purchase plus four repairs — takes about 11 months. Better play is faster; the cap does not move.
Player-growth scenarios
We do not know how many people will play. So we ran four shapes of demand, from disappointing to very large, and one deliberately broken version of the game for comparison.
| Scenario | New stands per day | Total stands in 5 years | Note |
|---|---|---|---|
| Launch & plateau | ~195 for 6 months, then ~80 | ~60,000 | Demand also reacts to price: fewer players when a stand costs more GRAM |
| Hype then decline | ~390 for 3 months, decaying to ~10 | ~30,000 | The pattern of most play-to-earn launches |
| Large game | 1,500 for 5 months, decaying to 100 | ~500,000 | A genuine hit |
| Large game, no cap | same as above | ~500,000 | Stands produce forever. The classic design. |
Results
| Launch & plateau | Hype then decline | Large game | Large game, no cap | |
|---|---|---|---|---|
| Active stands, year 1 | 4,100 | 2,000 | 104,500 | 356,000 |
| Active stands, year 5 | 3,350 | 470 | 19,900 | 504,000 |
| LEMON price, year 5 | 0.15 | 0.15 | 0.15 | 0.0025 |
| Bank balance, year 5 | 369k | 23k | 1.06M | 0 |
| Operating reserve, year 5 (GRAM) | 185k | 36k | 2.0M | 0 since year 1 |
| Perpetual fund, year 5 (GRAM) | 436k | 286k | 10.6M | 3.4M |
| GRAM collected by the game, year 1 / year 5 | 265k / 129k | 347k / 33k | 10.9M / 2.0M | 6.1M / — |
| Team income, year 1 / year 5 (GRAM) | 29k / 25k | 37k / 8k | 1.18M / 391k | 660k / 38k |
| LEMON supply, year 5 | 3.7M | 1.7M | 81M | 192M (over cap) |
| Redemptions paid below 100:1 | none | ~5% of year 1, concentrated in six months; none after | none | 44% of year 1, ~77% of years 2–5 |
Active-stand counts are much lower than total stands sold because a stand now lives about 11 months and then retires — the players are still there, showing up again as repairs and new purchases. "Active" counts stands mid-cycle on a given day, not people.
Reading the results
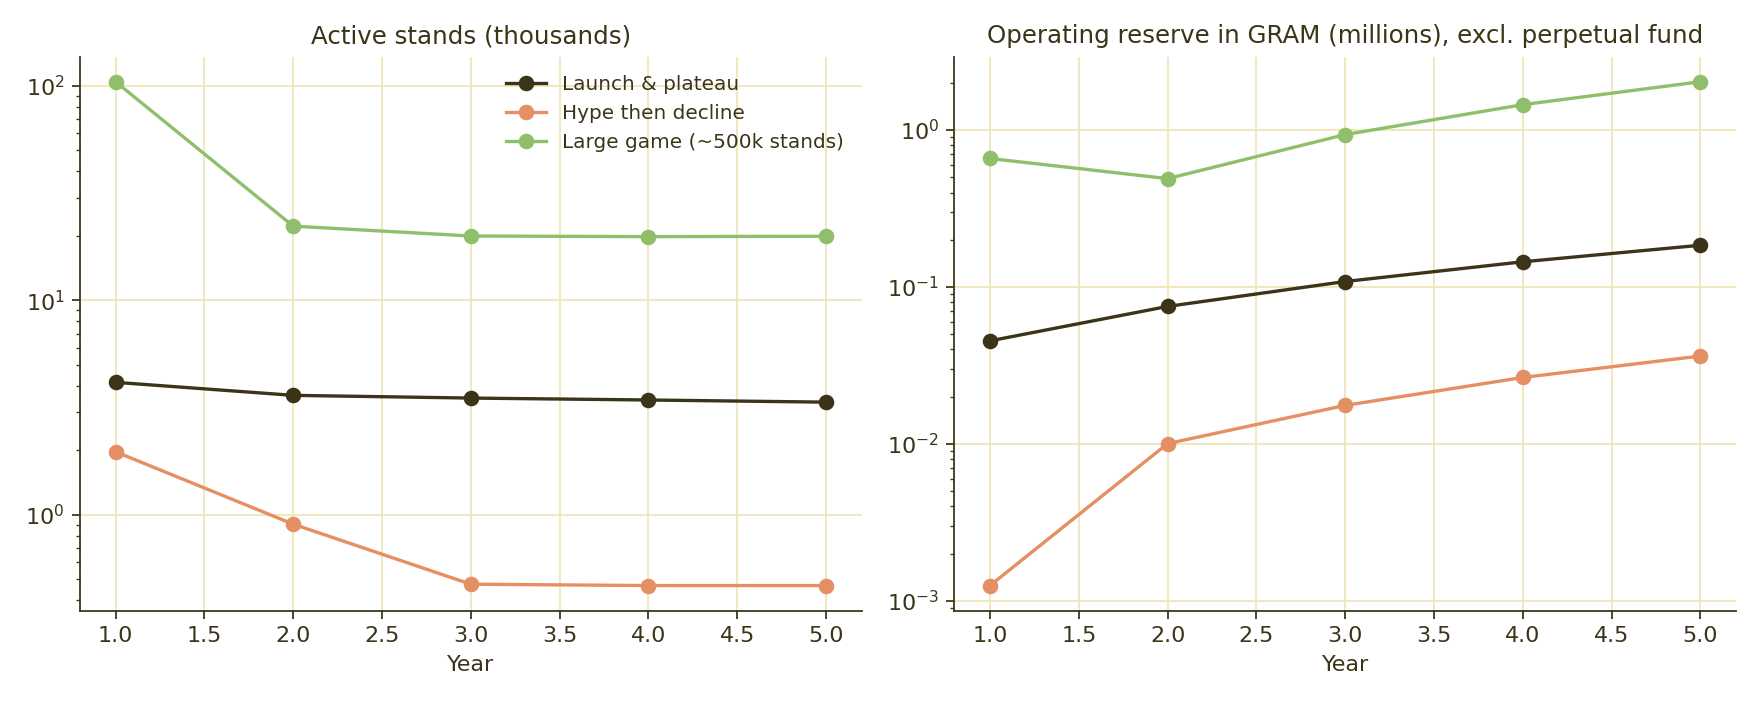
The game survives every scenario, including the disappointing ones. In "hype then decline" the crash bites exactly once: for six months of the first year the redemption rate dips below 100:1, and over that year players still receive about 95% of what they present. Every year after is paid in full, the game ends up small (≈470 active stands), and both the reserve and the fund keep growing. A small game that takes one visible, shared haircut and then works beats a large one that breaks.
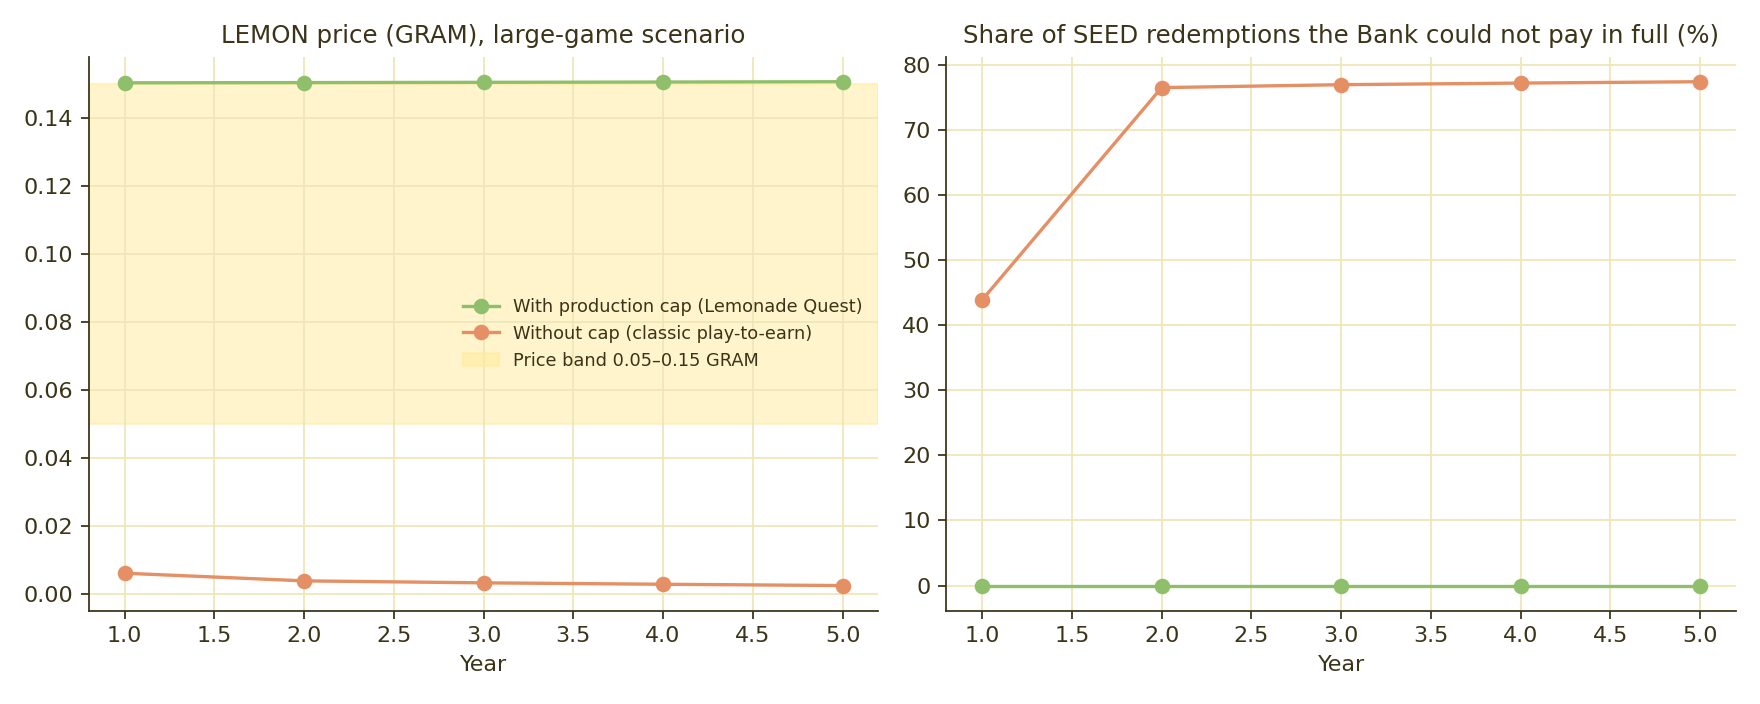
The cap is the whole difference. Same demand, same players, same band, same fund: without the production cap the reserve is exhausted in the first year defending the floor, the price falls to a fraction of a cent and about three-quarters of what players are owed from year two on cannot be paid. This is not a parameter we might loosen later.
Where the money for the team is. Almost all of it arrives in the first year, when demand for LEMON outruns what players sell, and again with every new wave of players. In months where players' own selling covers all demand the game collects nothing and the team lives on staking yield. Budget on the first year; treat the rest as maintenance.
Where the risk actually is. The Bank's balance is the number to watch. It is the timing buffer between a wave of redemptions and the sales that fund them. In the large scenario it touches zero in year one, when a boom of redemptions arrives before the next season's sales; it is covered by the emission allowance and reserve buybacks and no rate reduction was needed. A larger opening reserve, or a lower redeem share (a more engaging game), widens that buffer.
Sensitivity
| If… | Then… |
|---|---|
| Players redeem 100% of net instead of 80% | The Bank pays 120 per 100 received; it needs ~20% sales growth per cycle or the rate scales down. Optional spending is the margin. |
| Cycle cap 250% instead of 200% | Player net rises to 150%, Bank pays up to 150 per 100. Requires growth. Not planned. |
| Staking yield 5% instead of 12% | Fund burns less than half as much; dead-game recovery falls from ~11× to ~5× the no-fund case, still rising every year. At 20% it is ~18×. |
| Stand life unlimited | See the last column above. |
What the model does not capture
Marketplace trading between players, seasonal events, equipment revenue in GRAM, and the effect of dynamic city prices on total production (which only helps). It also assumes staking yield is paid without interruption. Treat every number as a shape, not a forecast.